
Charting Fan Happiness: A Pointless Use of My Time
I'm a Leafs fan, and as a Leafs fan, I have a duty to be completely miserable all of the time. Now, I thought that was kind of an interesting idea for fancy stats. How can we chart the happiness of a fanbase? What criteria go into deciding whether a fanbase is happy or sad? Well, I chose some, and charted the happiness, over the course of a season for two separate teams.
First up is the sky-high 2016-17 Pittsburgh Penguins, not to be confused with the sky-high 2017-18 Penguins.
Yes, the amazing 2016-17 Pittsburgh Penguins. Repeat Stanley Cup Champions led by Phil Kessel and some other guys. This is a team loaded with star players and high-octane offense. So, fans had plenty to be happy about. I was originally going to do the Edmonton Oilers, but then I remembered they blocked me from their subreddit, so fuck them! :)
Anyways, let's look at the chart:
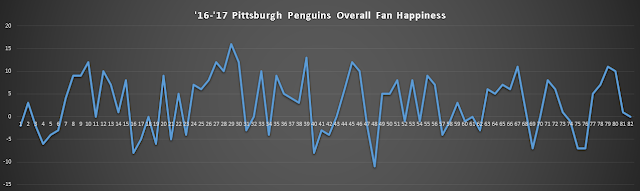
There you have it, the literal ups-and-downs of an NHL season. Now, to understand what these numbers mean, we need to know how they are came upon. We start with wins and losses, because even a dumb asshole can understand that winning feels better than losing. Wins are worth 1 and losses are worth -1, this allows us to use 0 as a value for ties, if we choose to look back at that era.
Then we factor in streaks, for every game won in a streak (not including the 1st of either) are worth a graduating factor of +1. So, for the 5th win in a row, they are award +4 happiness points. An additional +1 point is added if the team defeats a divisional opponent, or the inverse if they lose to one. Here we can see how Pittsburgh's streaks contributed to their overall happiness graph:

You can see that the team had an extremely successful January after a shitbox first couple months.
Additional "boosters" include draft position, the addition or subtraction (via trade/retirement) of a star player and goal differential. That means, if the team wins by 5 goals, they are awarded 5 points. Big wins count for big happiness. Here is the chart for Pittsburgh's goal differential..

As you can see, we could rely on this in place of wins and losses, but my figuring is that a win feels good, but not as good as a 7 goal win, that's something a bit extra.
The other booster that really came in to play in this measurement was injuries. Wow. I don't know how the team made the playoffs, nevermind won the Cup. They must have been one of the most injured teams in the season, and the players injured only amplified that. Below is the chart for injuries. Injuries were worth -1 for a depth player (eg: Matt Cullen, Trevor Daley) and -5 for a star player (eg: Evgeni Malkin, Sidney Crosby, Matt Murray and of course, Kris Letang). The difference between depth and star players was mostly my discretion, so your opinion on who is what may differ from my own.

There you have it, that's how I've charted the happiness of Pittsburgh Penguins fans. For perspective, below are the 2016-17 Oilers (because I didn't do all that work for nothing) and the 2016-17 Avalanche...

As you can see, they had just an unreal season when it comes to fans having reason to cheer. The Taylor Hall deal was technically done in the off-season, so it isn't shown here. Below is a look at their streaks and goal differentials.


Now, for a look on the other side of things. Abject sadness and misery. The Colorado Avalanche. Wow, what a hopeless season.

So, now is a decent time to explain that above 0 isn't necessarily happy. You really need to get to about 8 and above for any meaningful sense of joy. As you can see, there wasn't much of joy for Avs fans this past season, and much of that is to do with their complete lack of consistency.

They never put more than 2 wins together. It's hard to even call that a streak. This is just a ridiculous looking chart. I can't imagine how it felt for those poor fans watching their team never even get the engine started.
The only thing that kept them afloat was their draft positioning (never minding how that turned out). Being in dead last, with the top pick is worth 10 points, bottom 2-5 is worth 5 points. It is balanced with their playoff positioning though, where top 2 spots in the division is worth +4, 3rd is worth +2, 4th is worth 0, 5th is worth -2 and below that is worth -4. Here's how they interact:

What a brutal year.
Thanks for reading.
First up is the sky-high 2016-17 Pittsburgh Penguins, not to be confused with the sky-high 2017-18 Penguins.
Yes, the amazing 2016-17 Pittsburgh Penguins. Repeat Stanley Cup Champions led by Phil Kessel and some other guys. This is a team loaded with star players and high-octane offense. So, fans had plenty to be happy about. I was originally going to do the Edmonton Oilers, but then I remembered they blocked me from their subreddit, so fuck them! :)
Anyways, let's look at the chart:

There you have it, the literal ups-and-downs of an NHL season. Now, to understand what these numbers mean, we need to know how they are came upon. We start with wins and losses, because even a dumb asshole can understand that winning feels better than losing. Wins are worth 1 and losses are worth -1, this allows us to use 0 as a value for ties, if we choose to look back at that era.
Then we factor in streaks, for every game won in a streak (not including the 1st of either) are worth a graduating factor of +1. So, for the 5th win in a row, they are award +4 happiness points. An additional +1 point is added if the team defeats a divisional opponent, or the inverse if they lose to one. Here we can see how Pittsburgh's streaks contributed to their overall happiness graph:

You can see that the team had an extremely successful January after a shitbox first couple months.
Additional "boosters" include draft position, the addition or subtraction (via trade/retirement) of a star player and goal differential. That means, if the team wins by 5 goals, they are awarded 5 points. Big wins count for big happiness. Here is the chart for Pittsburgh's goal differential..

As you can see, we could rely on this in place of wins and losses, but my figuring is that a win feels good, but not as good as a 7 goal win, that's something a bit extra.
The other booster that really came in to play in this measurement was injuries. Wow. I don't know how the team made the playoffs, nevermind won the Cup. They must have been one of the most injured teams in the season, and the players injured only amplified that. Below is the chart for injuries. Injuries were worth -1 for a depth player (eg: Matt Cullen, Trevor Daley) and -5 for a star player (eg: Evgeni Malkin, Sidney Crosby, Matt Murray and of course, Kris Letang). The difference between depth and star players was mostly my discretion, so your opinion on who is what may differ from my own.

There you have it, that's how I've charted the happiness of Pittsburgh Penguins fans. For perspective, below are the 2016-17 Oilers (because I didn't do all that work for nothing) and the 2016-17 Avalanche...

As you can see, they had just an unreal season when it comes to fans having reason to cheer. The Taylor Hall deal was technically done in the off-season, so it isn't shown here. Below is a look at their streaks and goal differentials.


Now, for a look on the other side of things. Abject sadness and misery. The Colorado Avalanche. Wow, what a hopeless season.

So, now is a decent time to explain that above 0 isn't necessarily happy. You really need to get to about 8 and above for any meaningful sense of joy. As you can see, there wasn't much of joy for Avs fans this past season, and much of that is to do with their complete lack of consistency.
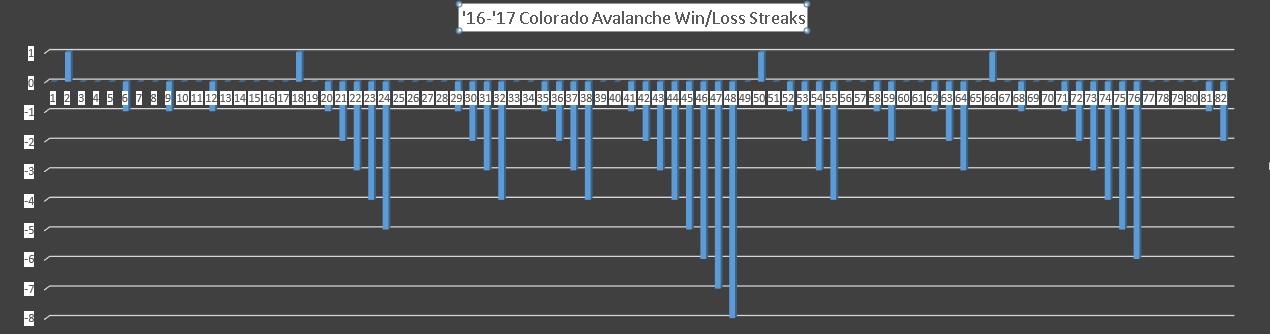
They never put more than 2 wins together. It's hard to even call that a streak. This is just a ridiculous looking chart. I can't imagine how it felt for those poor fans watching their team never even get the engine started.
The only thing that kept them afloat was their draft positioning (never minding how that turned out). Being in dead last, with the top pick is worth 10 points, bottom 2-5 is worth 5 points. It is balanced with their playoff positioning though, where top 2 spots in the division is worth +4, 3rd is worth +2, 4th is worth 0, 5th is worth -2 and below that is worth -4. Here's how they interact:

What a brutal year.
Thanks for reading.


Comments
Post a Comment